
ERSSTv.3b Animations


ERSST v. 3b
Gridded SST reconstructions based on COADS and iCOADS data sets have been made available by various organizations (UKMet - HadSST; NOAA - ERSST). These datasets have many purposes and are increasingly used as a calibration basis or verification basis for proxy records in remote locations. Researchers in the Rosenheim group employ these records to ascertain spatial heterogeneity in SST climate change in comparison to proxy records, with focus on the Caribbean Sea. Undergraduate researcher Shengzhi Wang (Tulane University) has been involved in processing and analyzing data, and Ph.D. student Alvaro Fernandez (Tulane University) is comparing proxy records and relating them to ERSST. Here, we make available some animations of the ERSSTv3b data set to visualize climate change in the surface of the largest heat reservoir of our climate system. Please email Brad Rosenheim with questions or suggestions about the animations.


Annual Anomalies - ERSSTv.3b anomalies calculated from 1971-1990 climatology.
Annual Average - ERSSTv.3b annual average temperatures, emboldened 26.5 C isotherm for tropical cyclone genesis is highlighted and compared to first frame.
DJF SSTs - ERSSTv.3b December-January-February averages, emboldened 26.5 C isotherm for tropical cyclone genesis is highlighted and compared to first frame
JJA SSTs - ERSSTv.3b June-July-August averages, emboldened 26.5 isotherm for tropical cyclone genesis is highlighted and compared to first frame.

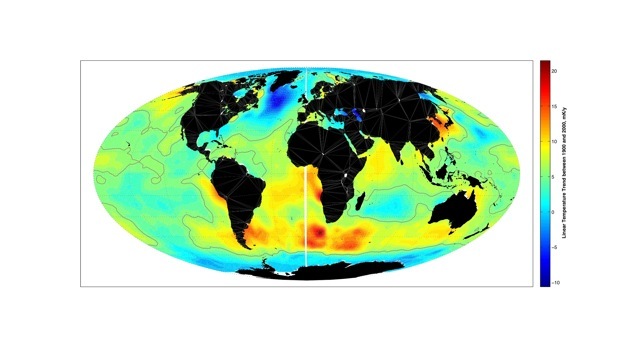
Linear trends in ERSSTv.3b grid squares, 1900-2000. 6 mK/y delineated as approximation of MBH 1998 “hockey stick.”