Large-eddy simulation and parameterization of buoyant plume dynamics in stratified flow
Abstract:
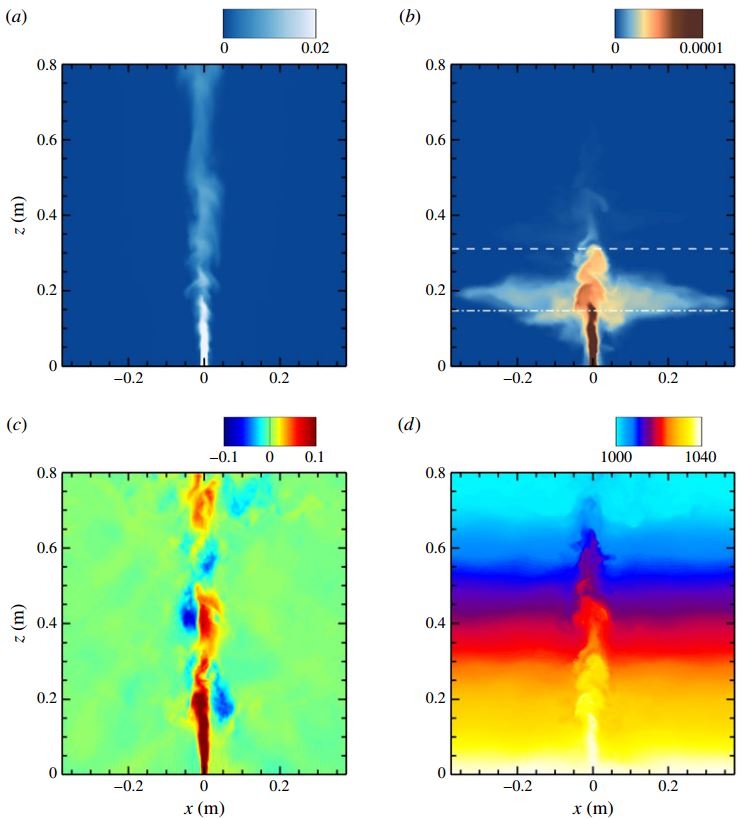
Characteristics of laboratory-scale bubble-driven buoyant plumes in a stably stratified quiescent fluid are studied using large-eddy simulation (LES). As a bubble plume entrains stratified ambient water, its net buoyancy decreases due to the increasing density difference between the entrained and ambient fluids. A large fraction of the entrained fluid eventually detrains and falls along an annular outer plume from a height of maximum rise (peel height) to a neutral buoyancy level (trap height), during which less buoyant scalars (e.g. small droplets) are trapped and dispersed horizontally, forming quasi-horizontal intrusion layers. The inner/outer double-plume structure and the peel/intrusion process are found to be more distinct for cases with small bubble rise velocity, while weak and unstable when the slip velocity is large. LES results are averaged to generate distributions of mean velocity and turbulent fluxes. These distributions provide data for assessing the performance of previously developed closures used in one-dimensional integral plume models. In particular, the various LES cases considered in this study yield consistent behaviour for the entrainment coefficients for various plume cases. Furthermore, a new continuous peeling model is derived based on the insights obtained from LES results. Comparing to previous peeling models, the new model behaves in a more self-consistent manner, and it is expected to provide more reliable performance when applied in integral plume models.


